
Return Reasons
This report can be found in the Aurora Back-end under Aurora Backend > Reports > Returns > Return Reasons and is intended to give you an insight into why customers are returning their orders.
This article explains how to use the Return Reasons Report and explains its results.
Introduction
This report can be found in the Aurora Back-end under Aurora Backend > Reports > Returns > Return Reasons and is intended to give you an insight into why customers are returning their orders.
Using this report, you are able to split the data down by Product and even individual Variations (e.g. Sizes) or simply collect an overall report of returns and the given reason(s).
By default, the report will show you the 'overall' view of this data.
The report uses Aurora's Background generation process to ensure that when the report is being generated, it does not:
- Cause resource issues on the server
- Lock up your browser while the report is being generated
These reports can take a long time to be generated (several minutes in some cases) and so this background process is necessary to mitigate this problem.
Where Is The Report?
The report can be found in the Aurora Back-end under Aurora Backend > Reports > Returns > Return Reasons.
How Long Should It Take To Generate A Report?
This depends on the date ranges selected and the type of breakdown you choose for the report, e.g. "Overall (by Product)" or "Overall (by Product Variation)", but it can take anywhere from 1 to 10 minutes to generate a report.
This can also be affected by the load from other systems on the Aurora background tasks system. The intention is to allow Aurora to manage its resource without disruption to the Front-end Website - so if demand for background tasks are high, then this may also result in the report taking longer to be processed.
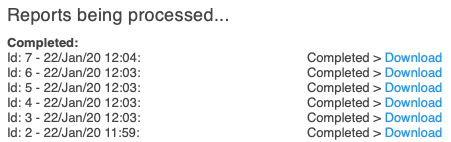
You can track the progress of reports being generated using the "Reports being processed..." section that appears when there are reports that were recently (usually within the last 24 hours) generated or requested for generation. See an example of this below.
Also, Aurora will email you a link to your report if you provide your email address when submitting the report for generation, so that you can avoid having to check the reporting page repeatedly.
Filters
This report accepts various filters to refine the results, as shown below:
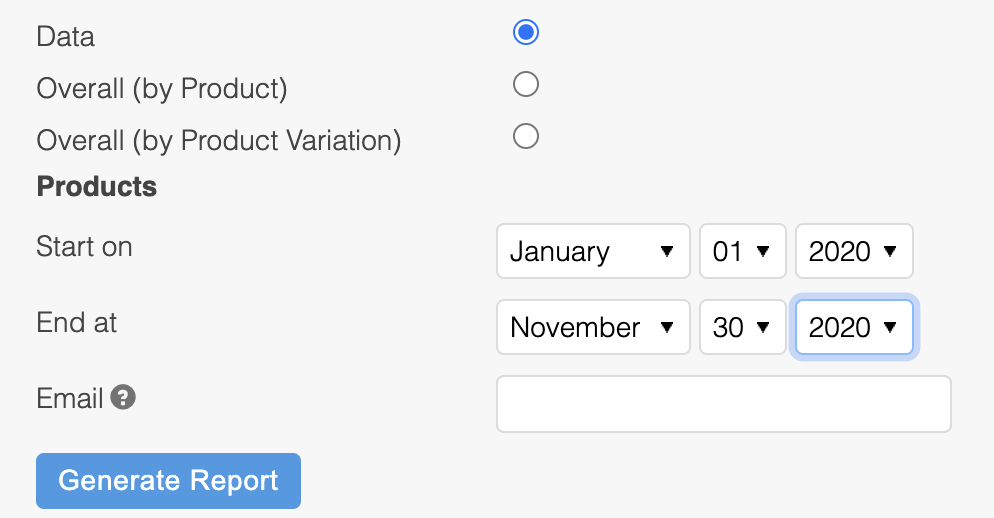
Please click Generate Report to queue your report for generation and provide an email address if you would like to be notified when it is complete.
Results
There are three options for the breakdown of the data for this report:
- Data
- Overall (by Product)
- Overall (by Product Variation)
Each offers a more detailed insight into the returns you have received than the previous.
Report "Data" Breakdown
This breakdown will display results in a table with these columns:
- Reason - The reason given for the return.
- Returns - The number of returns that have this reason assigned to them.
- Percent - The percentage of returns that have been given this reason, e.g. if you have 10 returns in total and 5 of these have a reason of "TOO BIG", then this would mean that "TOO BIG" has a 50%.
Report "Overall (by Product)" Breakdown
This breakdown will display results in a table with these columns:
- Product - The product for which the return occurred (this includes all variations of that product as one summarised total).
- Reason - The reason given for the return of this product.
- Returns - The number of returns that have this reason assigned to them for this product.
Report "Overall (by Product Variation)" Breakdown
This breakdown will display results in a table with these columns:
- Product - The product variation for which the return occurred (e.g. this is the returns for a particular size of a product, with each size having its own dedicated row in the report).
- Reason - The reason given for the return of this product.
- Returns - The number of returns that have this reason assigned to them for this product.
Updated 4 months ago