
Advanced Comparisons
The Dashboard gives you the ability to not only compare date ranges, but also compare various types of information - all on the same chart, at the same time.
This article helps you compare these different types of information.
Comparing Different Types of Information
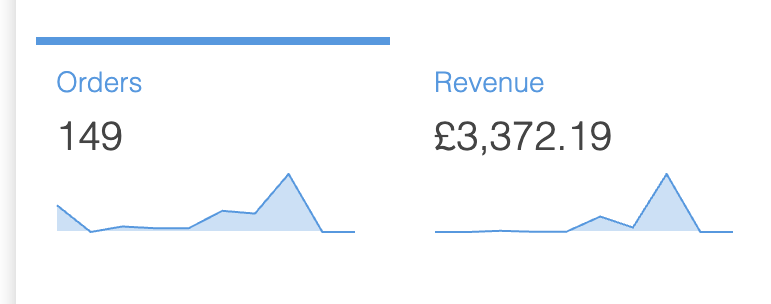
To get started, select one of the six core metrics to use as a benchmark. The selected core metric will be indicated by a thick border.
Select the type of information you would like to compare this to using the Select comparison data drop down menu located to the top right of the main core metric chart.
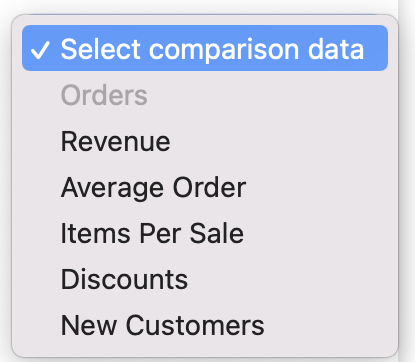
The core metric you selected as a benchmark will be greyed out in the drop down menu and therefore not selectable.
Once a selection is made, a comparison is automatically produced and the main core metric graph is updated.

You can change the types of information being compared by selecting either a different benchmark core metric, or using the drop down menu to select an alternative comparison - the chart will automatically update.
You can cancel a comparison by selecting Select comparison data from the drop down menu.
Comparing Date Ranges and Information Simultaneously
The Dashboard gives you the ability to compare different types of information - in addition to different date ranges - on the same chart, at the same time.
To do this, you can either:
- Select a comparison between two core metrics, and then select a second date range for comparison.
- Select two date ranges first, and then select a type of information to use as a comparison.

Would you like more detailed charts?Don't forget, at any time, you can increase or decrease the detail of your charts using the menu located to the top left of the page.
Updated 4 months ago