
Reporting Suite
The Aurora Reporting Suite is a highly customisable reporting tool intended to give a wide range of insight into your own data.
This article details how the reporting suite works.
Introduction
The idea behind the new reporting suite is to let you produce the reports you want without the need to wait for any new report to be made.
Creating a report
There are several options available for customising reports, ordered into four different areas:
- Date Range
- Filtering
- Grouping
- Ordering
- Columns
Date Range
The date range is set in the top right hand corner and is visible regardless of the other tabs that have been selected.
Filtering
The filtering section allows the user to decide which values to filter for when producing the report.
By selecting values for each of the filters, it will alter the results (after clicking the "RELOAD REPORT" button) so that it will only match them. Everything else will be left out of the report.

Grouping
The grouping section determines which field is used to work out totals from all the results.

One example would be to group the data by each individual day. You would select 'Year', 'Month' & 'Day'. These selections would produce a report, where the figures are all sum totals based on the orders for each day.
When selecting any of these options the sum totals will be according to what has been selected. When more than one has been selected, it will group to every kind of field until it is unique and you should see the breakdowns specifically for what you want.
For example if you want to group by date and which country the orders were sent to, you would have results laid out like this:

As you can see there are several rows containing 2016 September 01 each with a different country. This is how it will break up each total using grouping.
Sorting
Whilst the default sort is Date Created, you can click on a column header to change the sort to that particular column. Further clicks on the same column header will toggle the sort between ascending and descending order.
Complex sorts can be created by dragging multiple sorts from the Available sort options field to the Sorting options field. The order that these sorts appear in the Sorting options field will determine the order in which the sorts are applied.
Following on from the above example, where we grouped orders by month and then delivery type, we could sort these results first by date created, and then secondly by total orders, which would result in the most popular delivery types showing first for each month.
Each sort can be alternated between ascending and descending, by clicking on the A-Z or Z-A section respectively. The value displayed at any time indicates how that sort is currently functioning.
Columns
This section determines which columns are shown in the results table. All that needs to happen is for you to just choose the columns you want to be shown in the table.

Results Table
The results of everything that has been selected will then be shown in the results table. The table contents can be restored by clicking on the column headings. There are icons to show which way they have been sorted. Sorting this way does not affect your form selections though and so will not be saveable.

Results Graph
A graph is also produced by the data that is populated in the table. This is always shown. The data that is displayed can be controlled using the check boxes in the results table headers.
Exporting Report
There is an option to export the report to a CSV. It is done by simply adding your email, and processing the Export to CSV. The report is then created in the background and will be emailed to you when ready.

If an email address is not provided, a CSV will be generated and downloaded in the foreground. If you provide an email address, this process will be carried out in the background, and an email sent to you once the CSV file is ready for download.
Depending on the size of the report, this may take some time.
Saving & Loading a report
These reports can operate as either a one off or they can be saved so that you can run the report at a later date. At present all reports are being shared with everyone.
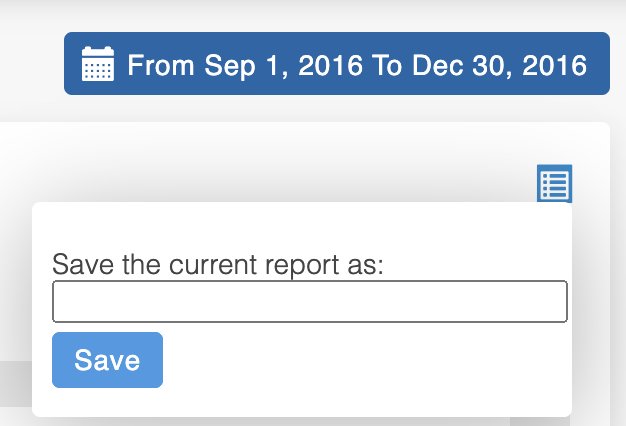
Saving
Once you have made your selections for the report, if you hover over the gears icon with the cursor in the top right hand corner, an option to save appears. All that is needed is to type in the name of the report and click on Save. If it already exists it will overwrite the report with the current standard.
Loading
In the same area as saving, there is a selection box where reports can be loaded. Just choose the correct report and then press load. The report settings will then be loaded in with the results being displayed.
Example reporting scenarios
Here is an example of how you would setup a report for particular scenario that you may want
Monthly sales by Payment Type
To work out the monthly sales grouped by payment type, go to the "Orders Report" and use the following settings:

These settings will then produce these kind of results, if every other tab is left on its defaults:

Coupons
To create a report for showing which coupons have been used along with the number of sales and discounts involved, go to the "Orders Report" and use the following settings:

This should produce results similar to this:

Updated 4 months ago