
Data Normalisation
Normalisation is an essential step in the preparation of your data for use with Blends and it is important to understand what it is and how it affects the data in Aurora and the result of your Blends.
The Basic Principle of Normalisation
In its simplest form, normalisation of data for statistical purposes means adjusting values measured on different scales to a notionally common scale. What this means is that if you have two incomparable values that you wish to compare on an even scale, e.g. Stock Level and Rating, you must 'convert' these values into something that is relative to one-another (this is the normalisation process).
For example, while a rating of 3 out of a maximum of 3 is considered to be very high, a stock level of 3 is not, especially if you have other products with a stock of 3000. To use both of these fields side-by-side in any meaningful manor, what we need to know is how relevant these values are. You do this by producing a value based on two things a) the value itself and b) the maximum potential value. In this way (using Linear Normalisation, which we will cover in more detail later in this document) you might convert the Rating of 3 to 100 and a Stock of 3 to 0.001. You now have your two normalised values and it is clear that Rating of 3 (100) is very relevant a stock of 3 (0.001) is close to irrelevant.
This is the idea behind the Normalisation that Aurora uses.
Normalisation Methods
Aurora supports three Normalisation Methods, each with their own specific characteristics. When 'making' your Blends, you can use any of these methods to normalise your data sources - each can provide very different results depending on the data being normalised.
All methods Normalise your data to a value between 0 and 100.
Linear Normalisation
Linear normalisation can very simply be thought of as a 'percentage' of the maximum value. So 3 of 3 would normalise to 100(%) and 3 of 3000 to 0.001(%), as illustrated in Figure 1.
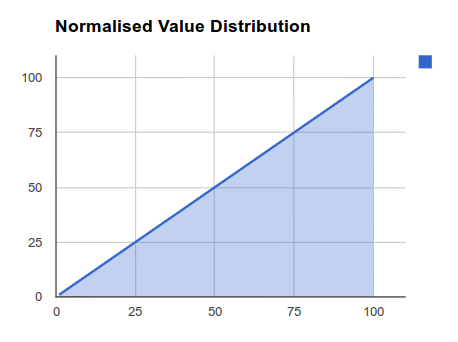
Figure 1: Linear Distribution
This method of normalisation is best used for progressive, evenly distributed data sources, like Rating systems, where is it is a very simple relationship between value and desirability, i.e. higher the better.
Logarithmic Normalisation
Logarithmic normalisation applies a much more subjective approach to the relevance of your values and is shown in Figure 2. What this basically does it reduce the impact of higher values on the relevance of your data.
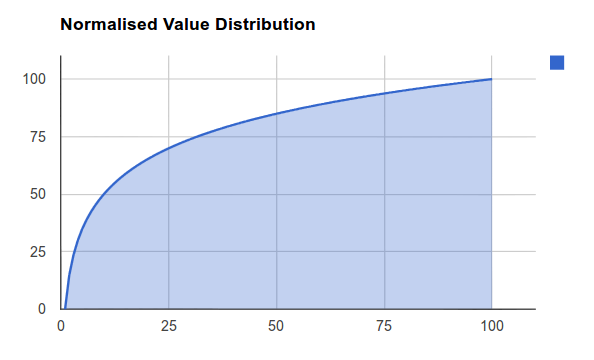
Figure 2: Logarithmic Distribution
Where this method can be very useful is for data that does not conform to any kind of even distribution and may well have large 'gaps' in its sequence of values. An example of this would be Stock, whereby the difference between a product having 1 stock and 20 stock is very significant indeed, while the same difference between 2001 stock and 2020 is close to irrelevant. Using the Logarithmic Method means that the data is provided with a much more meaningful 'weight' based on its relative value.
Bezier Curve Normalisation
This is currently an experimental normalisation method that will allow for highly advanced manipulation of the 'Curve' provided for your data normalisation. The kind of results you can get from this method resemble that of the Logarithmic method, however the curve produced can be modified to suit your data's specific distribution. Please find below some examples of the distributions possible.
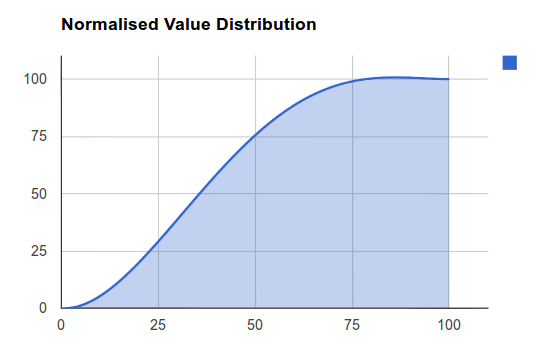
Figure 2.1: Bezier Curve Distribution A
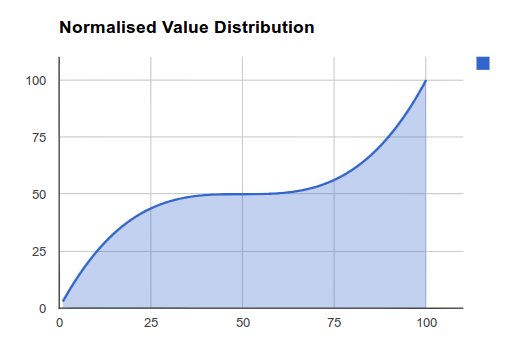
Figure 2.2: Bezier Curve Distribution B
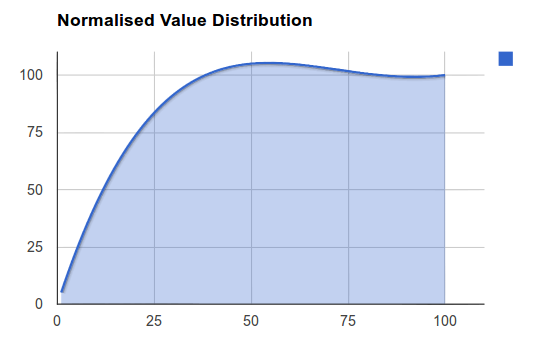
Figure 2.3: Bezier Curve Distribution C
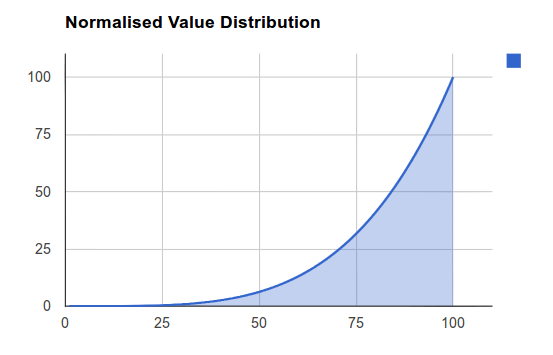
Figure 2.4: Bezier Curve Distribution D
Aurora's Normalisation Data
Aurora provides a very basic interface to preview your Normalised data sources by way of the Merchandising > Blends > Data Normalisation page. The graph you can see shows two things:
- The light blue line shows how your values are distributed across all your products. It shows the percentage of products (between 0% and 100%) that have any particular value, e.g. for stock, you should notice that most of your products are shown to have a stock level below 20. Knowing this allows you to select the optimal Normalisation method for that data.
- The normalised value that is given to the actual value. What this means is that you can check any given value (e.g. a stock of 30) and see what 'weight' (between 0 and 100) it will be given by seeing where the value is placed on the darker line.
What this graph lets you do is more accurately decide which Normalisation Method you would like to use for each data source.
If you find you have no Normalisation Data here at all, then this is likely because the necessary scripts have not been set-up on your server. You should contact your Aurora Commerce Account Manager for more details and/or a quote to have this work done.
Updated 4 months ago